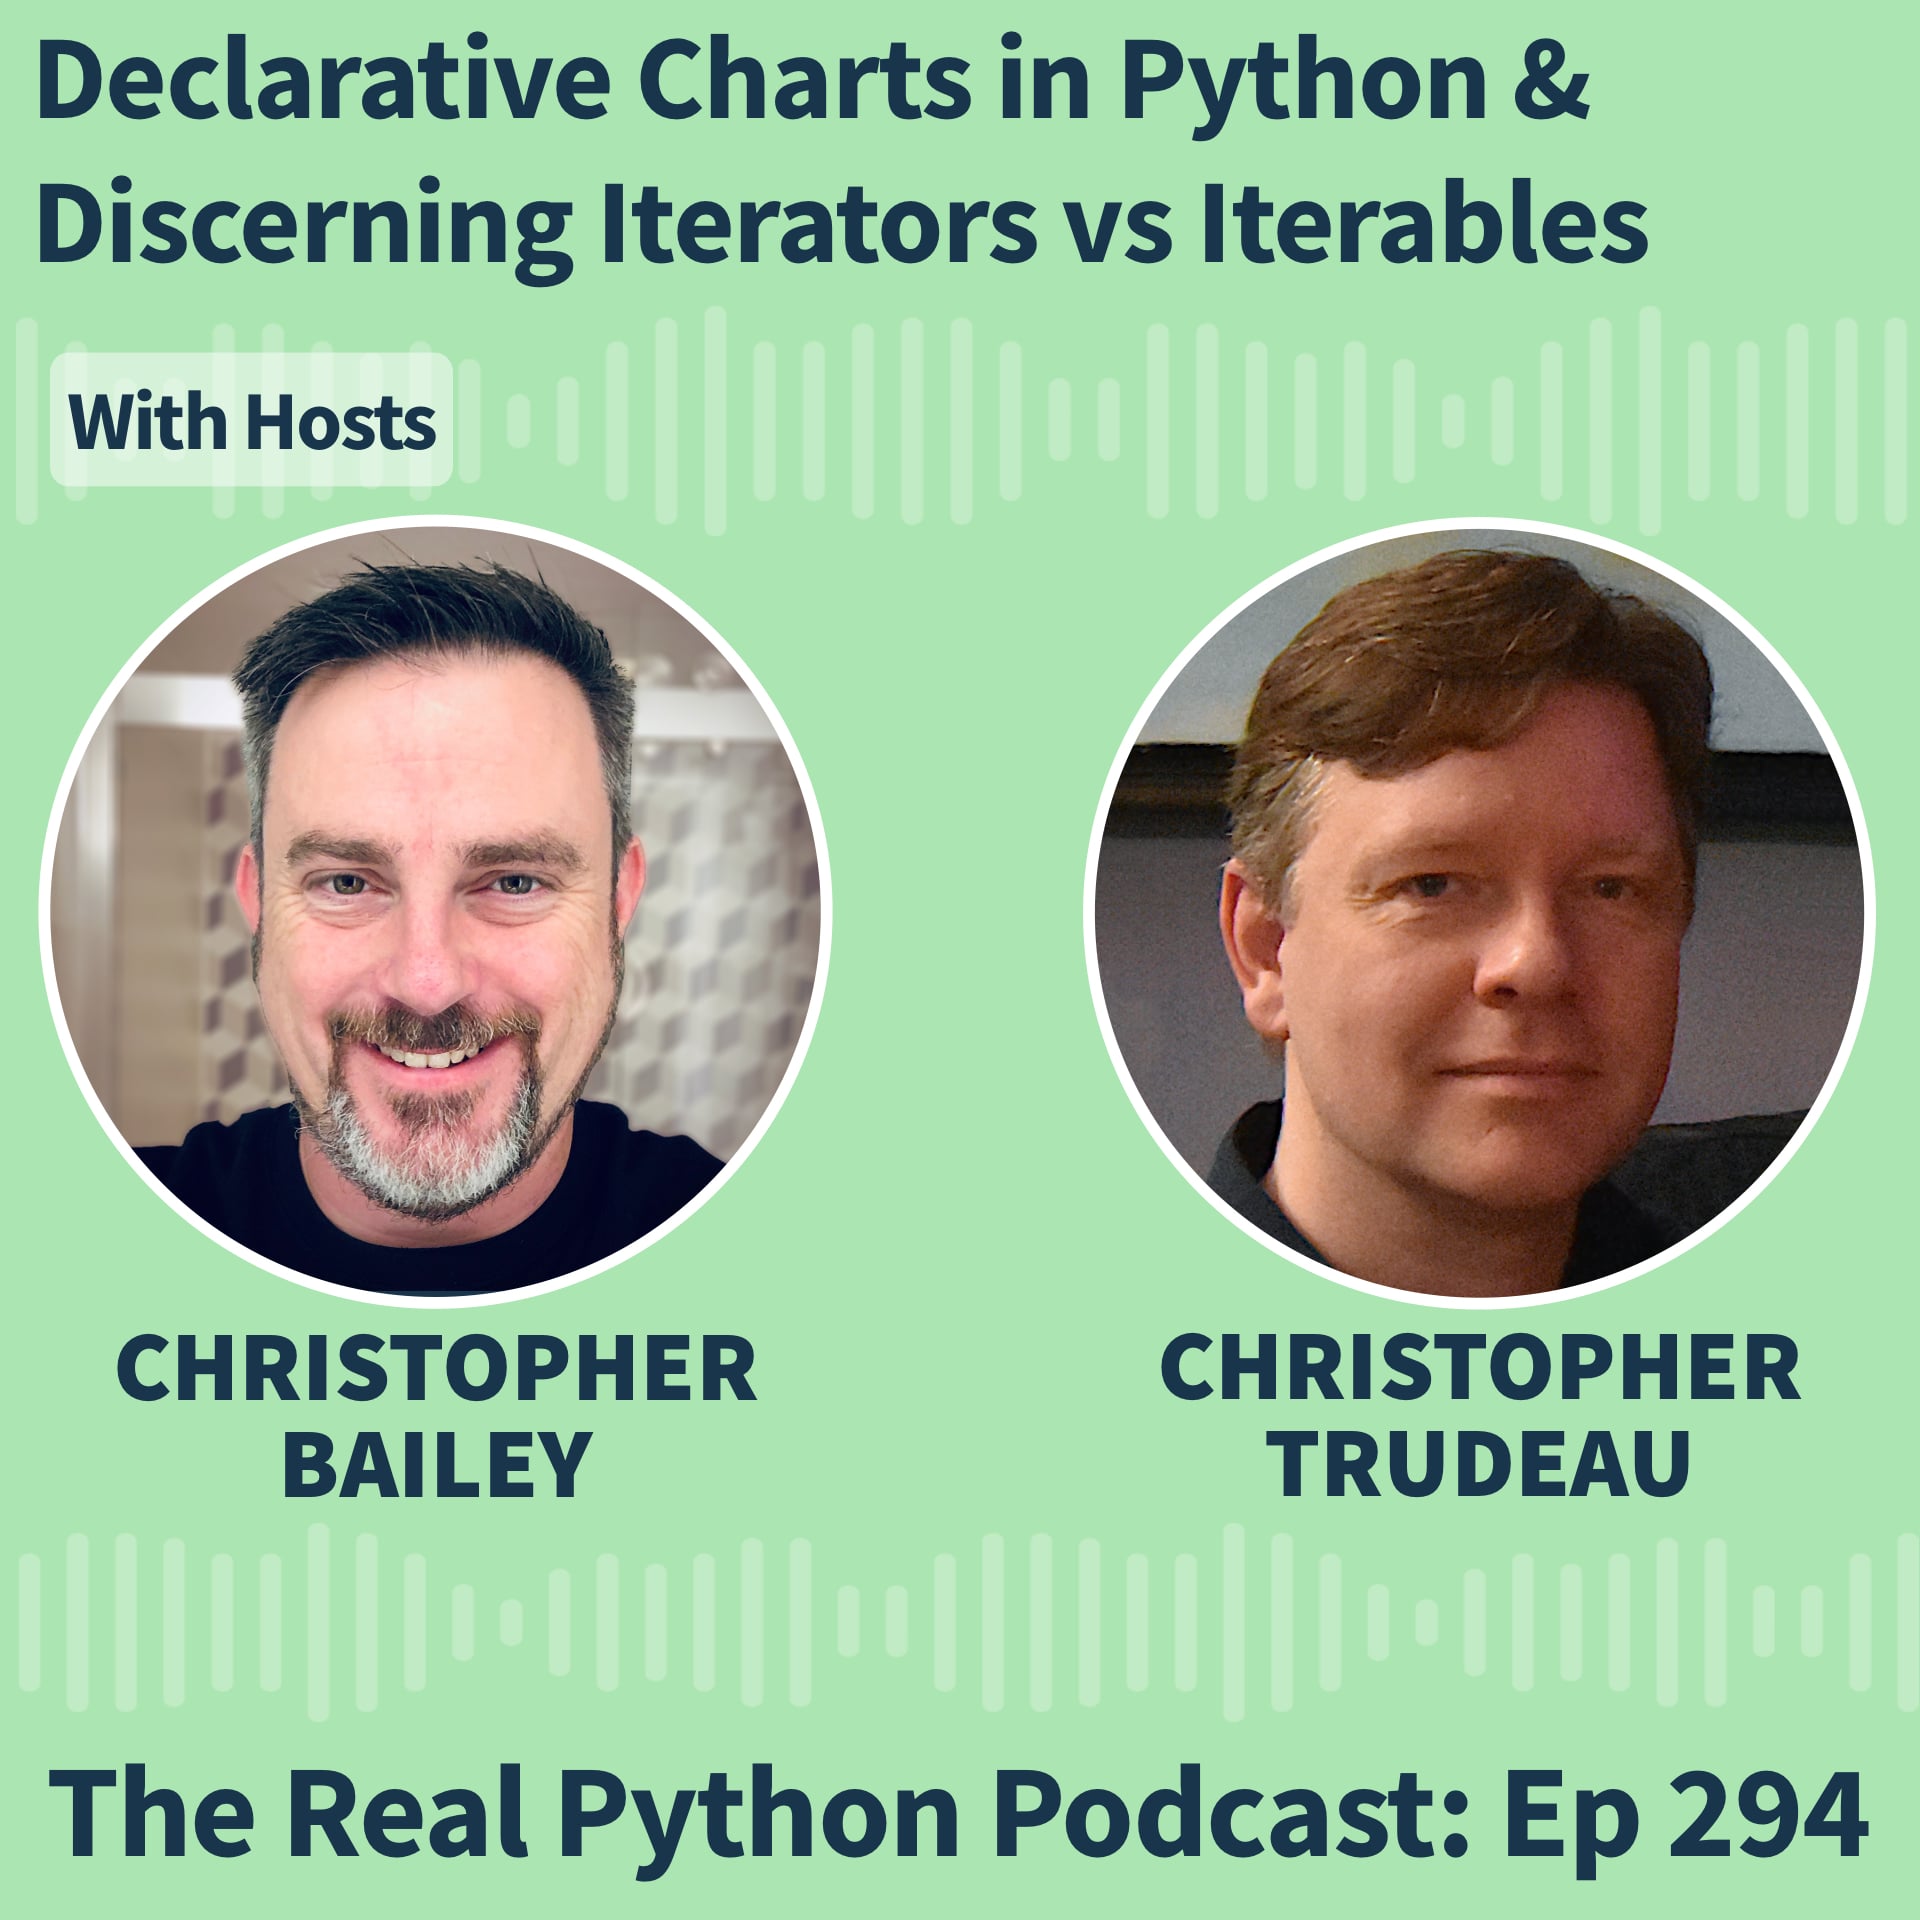
Declarative Charts in Python & Discerning Iterators vs Iterables
Episode 294
What if you could build charts in Python by describing what your data means, instead of scripting every visual detail? Christopher Trudeau is back on the show this week with another batch of PyCoder’s Weekly articles and projects. We cover a recent Real Python article about the data visualization library Altair. Most tools require you to write detailed boilerplate code to set up the axis and figure. Altair follows a declarative approach where you specify which columns go to which axis, the type of chart or plot, and what should be interactive. We also share other articles and projects from the Python community, including recent releases, clarifying the differences between iterators and iterables, decoupling your business logic from the Django ORM, comparing an LLM-based tool for web scraping against Playwright, a neural network emulator for guitar amplifiers, and a CLI tool to generate ASCII art of the current moon phase. This episode is sponsored by Build Your Own Coding Agent. Video Course Spotlight: Use Codex CLI to Enhance Your Python Projects Learn how to use Codex CLI to add features to Python projects directly from your terminal, without needing a browser or IDE plugins.
Publisher
The Real Python Podcast
Link
realpython.com/podcasts/rpp/294/
Published
May 8, 2026
Duration
56 min
Format
Podcast
Category
Issues · Tech News
Source
RSS feed
Host
Real Python
The Real Python Podcast
@realpythonpodcast
#declarativecharts #discerningiterators #iterables